Weekly Market Review:
Over the past week, the Bitcoin market experienced significant fluctuations. The opening price was 119,086.65 points, with a strong rally on Monday reaching the week's highest point of 123,218.00 points. However, the market could not sustain the gains, quickly falling on Tuesday to the week's lowest price of 115,736.92 points. Ultimately, the weekly closing price was set at 117,265.12 points, with a weekly decline of 1.55% and a maximum amplitude of 6.28%. This week's trading volume was 15.628 billion USD, with a green candle showing a long upper shadow, but notably, the price remained above the 5-week moving average.
The author previously predicted that the index had broken through the original high point of 111,980 points, opening up new upward space; next week's stock price would continue to rise while monitoring volume changes; Bitcoin's resistance was between 123,000 and 126,000 points; the support was between 111,980 and 110,530 points; the probability of a unilateral upward trend is low, with a higher probability of up and down oscillation in the new range (116,000-120,000).
Reviewing the actual trend this week, the author's prediction was fully confirmed. On Monday, after a slight high opening, the market quickly attacked, with a maximum increase of about 3.46%, refreshing the week's high of 123,218 points, then quickly falling back, closing with a small green candle with a long upper shadow, rising about 0.62%, with significantly amplified volume.
On Tuesday, the stock price adjusted downward, touching the week's lowest point of 115,736 points before slowly recovering, ultimately closing with a candle with a lower shadow, falling about 1.76%, with an amplitude of about 3.5%.
In the following trading days, the market oscillated and consolidated between the aforementioned high and low points. The week's highest point precisely touched the author's predicted resistance area, and the lowest point was also within the predicted range.
It can be said that this week's market trend highly matched the author's expectations. Next, the author will analyze the changes in the market over the past week from multiple cycle quantitative models.

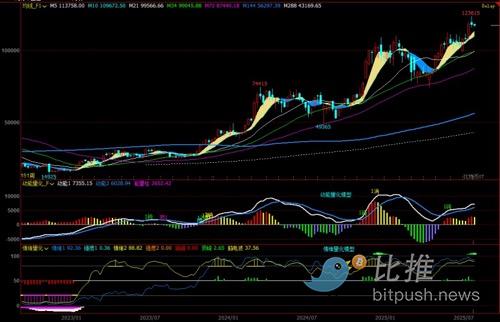
Figure One
1, As shown in Figure One, from the weekly chart:
①, Momentum Quantitative Model: The momentum quantitative model continues to show a high-level blunt state, strongly suggesting a significant increase in the possibility of momentum top divergence in the coming weeks.
②, Sentiment Quantitative Model: Influenced by the volume-driven rally at the beginning of the week, although the sentiment quantitative indicator has declined, the sentiment 1 indicator strength remains at 1.01 (range 0~10), and the sentiment 2 indicator is also approaching the high point, with the peak indicator recording 1.99. These data collectively indicate that market sentiment remains relatively high, and potential sentiment reversal should be watched.

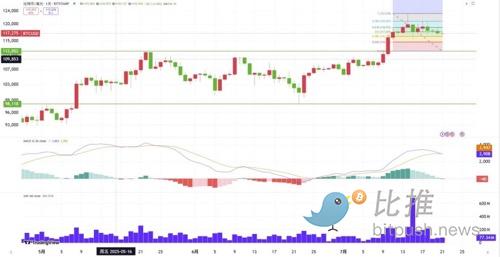
Figure Two
2, As shown in Figure Two, from the daily chart:
①, Momentum Quantitative Model: The daily-level momentum quantitative model continues to send a high-level blunt signal. The momentum 1 indicator line has transformed from rising to horizontal consolidation, and the energy bars are gradually shortening, indicating an increasing probability of short-term momentum top divergence.
②, Sentiment Quantitative Model: The sentiment quantitative model shows that influenced by the volume-driven high and pullback at the beginning of the week, the two sentiment indicators have begun to deviate from the high-level area, and market sentiment is becoming cautious.
④, Volume: The trading volume on Monday significantly expanded, with a candle showing a long upper shadow, clearly revealing massive selling pressure above.
II. Next Week's Market Forecast:
Given the market's characteristics of volume-driven stagnation this week, the author judges that the area around 123,218 points has a high probability of forming a recent high-level region.
Key Resistance Levels: The author observes that the first resistance is around 121,200 points, while the 123,000 to 126,000 point interval constitutes strong upper resistance.
Core Support Levels: Initial support is around 115,700 points, with secondary support at 114,200 points. The 111,980 to 110,530 point interval is a strong support area, which the author will focus on monitoring its support strength.
Oscillation Range Outlook: The market will continue to oscillate up and down within the new range.
III. Next Week's Operation Strategy (excluding unexpected news impact):
Medium-term Position Strategy: Given that the market is still running above the multi-short channel, the author suggests medium-term investors continue to control their positions and maintain existing holdings.
Short-term Position Strategy: Continuing last week's strategy, short-term operations should strictly follow the author's predicted support and resistance levels and set reasonable stop-loss points. Recommended high selling (around 121,200 points) and low buying (around 112,000 points).
The current hourly MACD indicator has formed a death cross above the zero axis, indicating potential short-term callback risks. Combining key technical levels, the author's short-term strategy is as follows:
a. If the resistance around 121,000 points can be effectively broken, short-term can consider going long and timing the entry;
b. If the market effectively breaks below the 116,500 point support, short-term may further callback to around 112,000 points. At that time, consider following the trend for a short position or patiently wait for a new support signal before layout for a rebound.
c. If the market continues to oscillate between 116,000 and 121,000 points, the author recommends short-term investors maintain a wait-and-see attitude.
Real-time Dynamics: The author strongly recommends investors closely follow the daily market commentary articles to obtain the latest operational perspectives and market interpretations in the first time.
Important Note: The above analysis and models are the trading rules followed by the author, but please note that this report does not constitute any investment advice or basis for buying and selling. All views are the author's personal insights and for reference only.
Author: BitpushNews Cody Feng
Twitter: https://twitter.com/BitpushNewsCN
BitPush TG Community: https://t.me/BitPushCommunity
BitPush TG Subscription: https://t.me/bitpush


