After nearly reaching the All-Time-High of around 4,878 USD just a few days ago, Ethereum is currently trading below 4,300 USD. Despite the price drop, it maintains a strong monthly increase of 15.3%, showing resilience.
But while many short-term investors are jumping in to "buy the dip", things are not entirely good for short-term traders. An important dump signal is beginning to appear on the 4-hour chart.
Short-term buyers are increasing, while reserves remain low
Ethereum's HODL wave chart shows that new buyers have been slowly accumulating over the past 30 days.
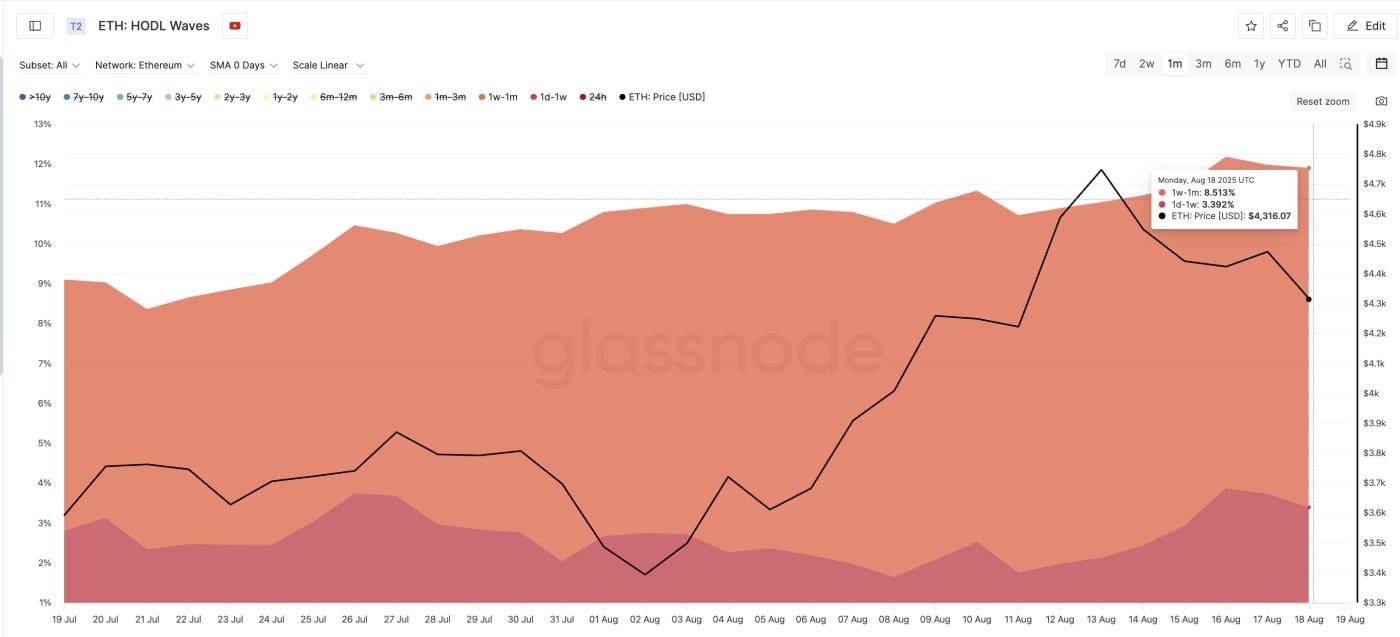 Ethereum price and HODL waves: glassnode
Two important short-term groups — ETH wallets holding from 1 day to 1 week, and from 1 week to 1 month — have increased their supply ratio:
- 1d–1w group increased from 2.8% to 3.39%
- 1w–1m jumped from 6.3% to 8.5%
This is a clear sign of new buying. It shows that buying during price drops is increasing from traders who likely participated in the recent price decline. HODL Waves shows the percentage of coins held in different time periods, helping to identify shifts between long-term and short-term investors.
For TA token and market updates: Want more information about such tokens? Subscribe to the Daily Crypto Newsletter by Editor Harsh Notariya here.
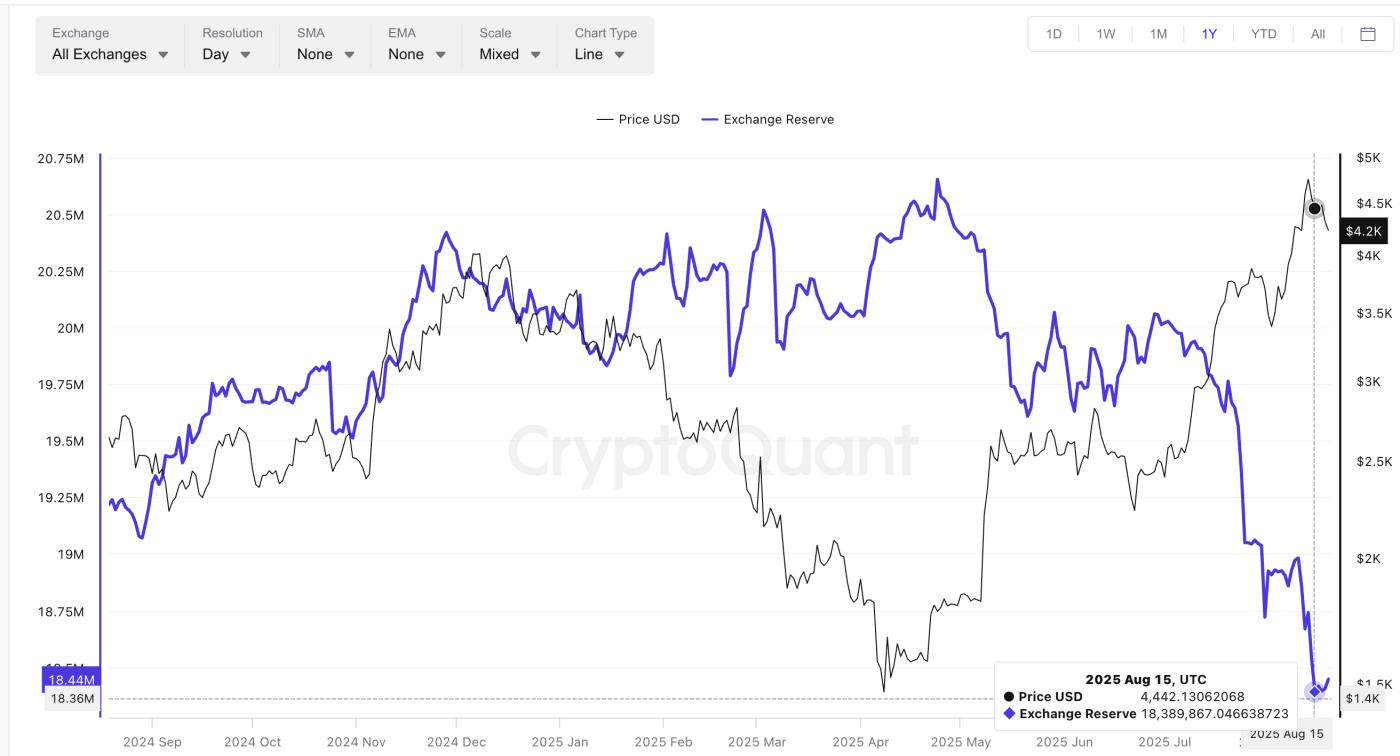 Ethereum reserves on exchanges near low levels: Cryptoquant
Meanwhile, Ethereum reserves on exchanges continue to hover around 9-year lows. Even after the ETH whale outflow, reserves only slightly moved from 18.389 million ETH on 15/08/2025 to 18.404 million ETH at the time of writing. This remains very low, meaning new buying continues to occur whenever Ethereum's price drops.
Low reserves typically mean fewer ETH are immediately available for sale; another good sign if traders are making long-term bets.
A chart pattern could push Ethereum down to 4,000 USD
Despite positive signs from buyers and exchange flows, the short-term chart shows a potential issue.
On the 4-hour chart, the 20-period EMA or exponential moving average (red line) is about to cross below the 50-period EMA (orange line) — a bearish "death" crossover. If this happens, it is usually considered a sign of imminent selling pressure.
EMA is a type of moving average that prioritizes recent prices, helping traders react more quickly to recent market changes. An EMA crossover occurs when a short-term EMA crosses above or below a long-term EMA, typically signaling a change in price trend direction.
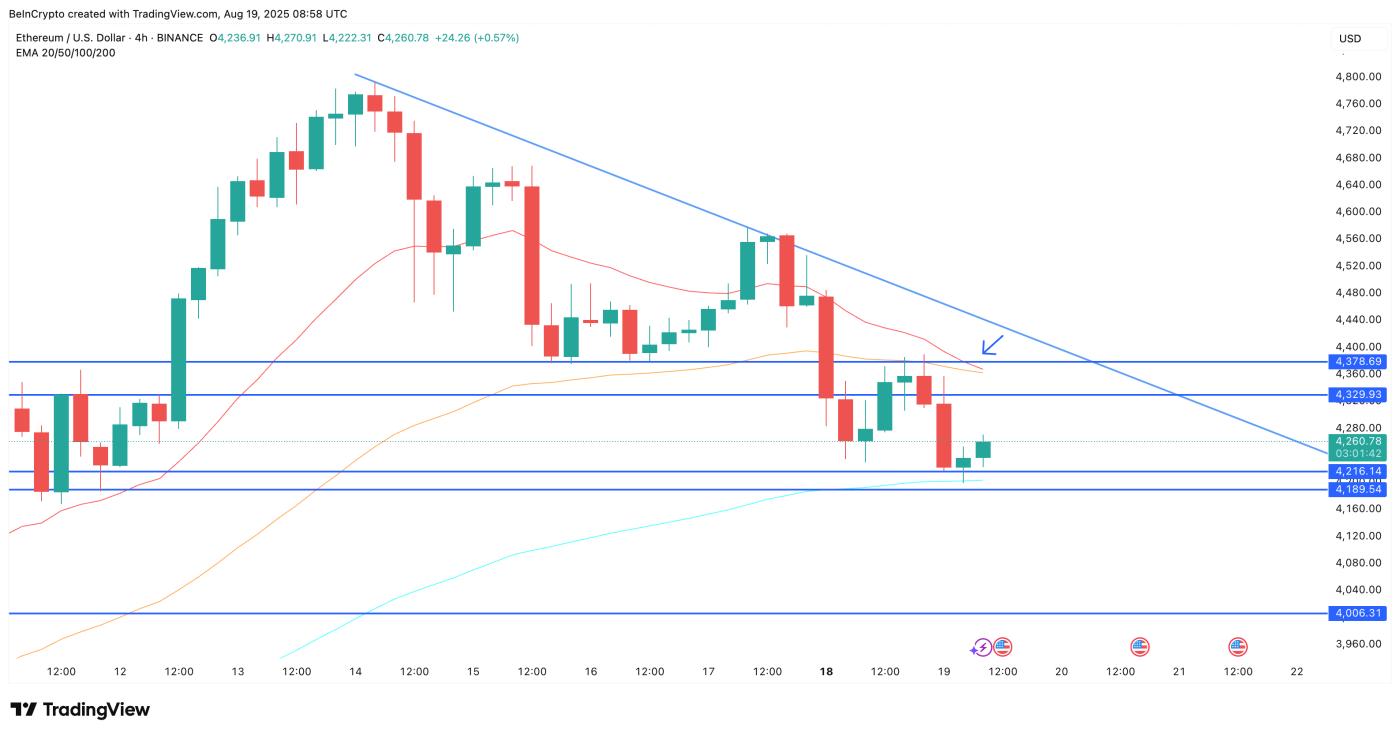 Ethereum price analysis: TradingView
Additionally, ETH price is forming a descending triangle, a continuation bearish pattern. It is testing two critical support levels: 4,216 USD and 4,189 USD. Breaking below these levels could trigger a stronger selloff.
The heat map shows weak demand zones just below these levels. With little strong support at these levels, ETH could quickly drop to 4,006 USD if sellers take control.
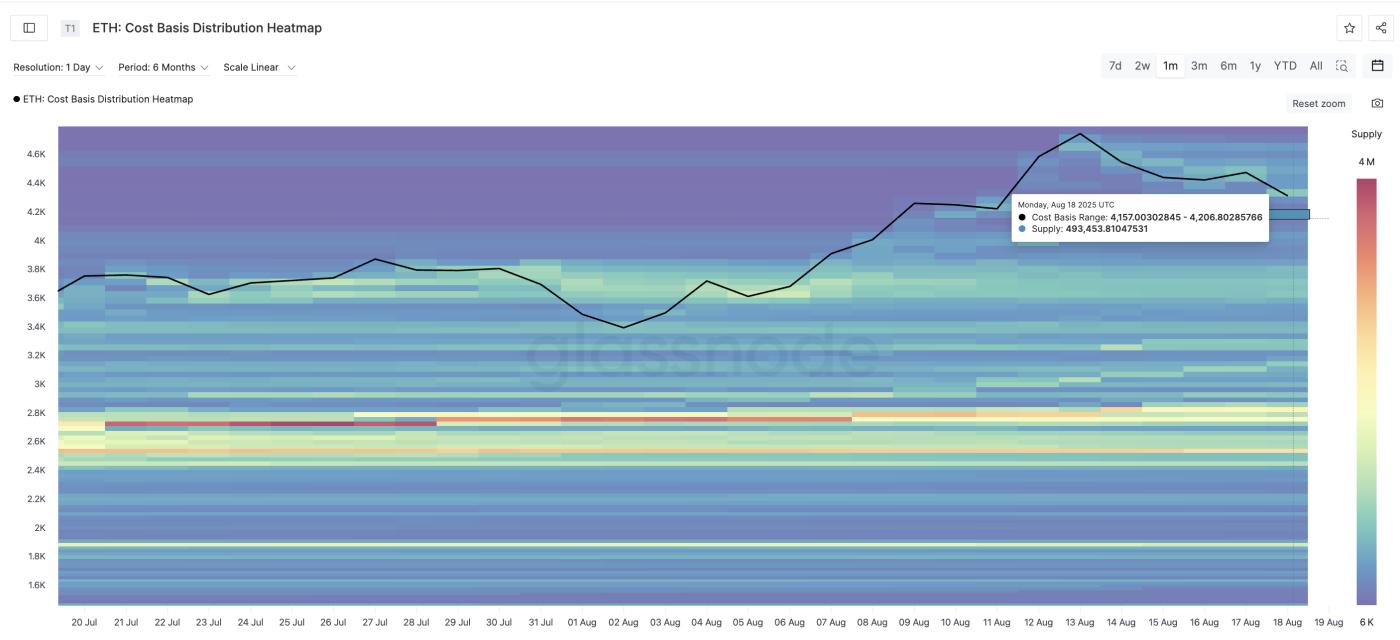 Ethereum price heat map: glassnode
The dump outlook would diminish if Ethereum can reclaim the 4,378 USD level. By doing so, it could nullify the bearish crossover and turn the 20-EMA and 50-EMA into support.