Source: Monthly Outlook: The Great Ethereum vs Solana Debate
Author: David Duong, CFA – Global Head of Research
Translator: Lenaxin, ChainCatcher
Original Title: Coinbase In-Depth Analysis: Ethereum vs Solana, Are Institutional Investors Trapped in an "Either/Or" Dilemma?
Overview
Institutional funds continue to flow into the BTC market, with Bitcoin currently accounting for 63% of the total cryptocurrency market capitalization. However, market focus is shifting to mainstream tokens like ETH and SOL, which are showing valuation advantages against the backdrop of Bitcoin's historical high.
Key factors influencing next quarter's market trend include:
Progress on the SEC's approval of spot ETFs.
Possibility of incorporating staking features into ETF products.
Continued institutional fund entry.
It's worth noting that the crypto community has long had a tendency to compare ETH and Solana in opposition, but in fact, their technological routes and investment logic are showing differentiated development, with potential for parallel market space.
Currently, the crypto community generally simplifies the competition between Ethereum and Solana to an "either/or" proposition, but in fact, their technological architectures and investment logics are showing differentiated development, with the possibility of parallel development.
For example, institutional participants are increasingly using ETH as a proxy for the broader real-world assets (RWA) theme - covering a wider range of areas including stablecoins, payments, and tokenization.
Solana's investment concept is focused on its network's advantages in speed, user engagement, and revenue generation compared to competitors. While its activity is primarily concentrated on meme coin trading, it has also gained attention in other areas.
In the short term (Q3 2025), against the backdrop of an overall favorable market, the market momentum of these two tokens will be more driven by technical factors (i.e., supply and demand) rather than fundamentals, with the substantive impact of network technical upgrades potentially being relatively limited.
False Dichotomy
The technological route dispute between Ethereum (ETH) and Solana (SOL) has long influenced institutional investors' value assessment of blockchain platforms. Market views are notably divided: traditional institutional investors generally value Ethereum's security and decentralization characteristics, making it an important infrastructure for real-world asset (RWA) tokenization; supporters argue that Solana has a competitive advantage with higher transaction speeds and lower costs. As Ethereum's Layer 2 scaling solutions continue to develop, this technical discussion is becoming more complex.
Table 1. Comparison of Ethereum and Solana Network Metrics
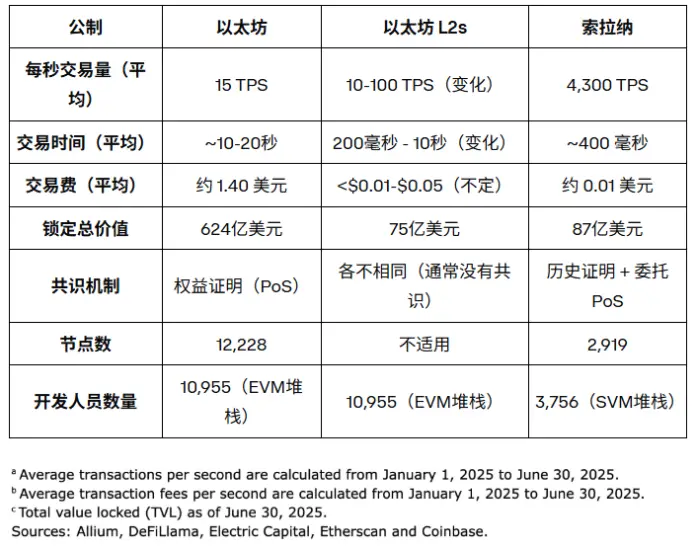 These arguments represent a false dichotomy, not because the technological differences are unreal or unimportant, but because the reasons for engaging with ETH, SOL, or both at any given time are more sensitive to market conditions.
When Will the Altcoin Season Arrive?
A significant difference in the current cryptocurrency cycle compared to previous cycles is the absence of an altcoin season. Data shows that over the past year, many retail investors suffered losses while trading meme coins and long-tail altcoins, leading to insufficient funds or a wait-and-see sentiment. In this context, although some altcoins have recently outperformed ETH and SOL, price trends still tend to make many institutional investors prefer holding blue-chip stocks.
ETH's Turning Point
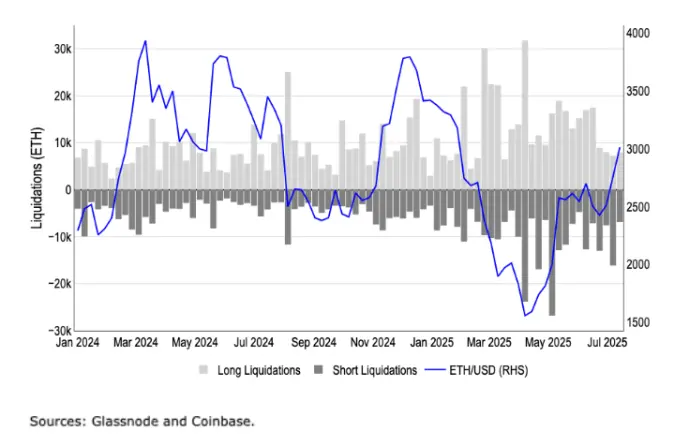
In early May, the ETH market experienced a large-scale short liquidation, with clearing scale significantly rising. Figure 1 shows that in May, approximately $897 million (374,000 ETH) of ETH shorts were liquidated, compared to $575 million in April and $467 million in March. This triggered a technically driven surge, highlighting the large number of over-leveraged positions in ETH, causing short covering and subsequent margin calls. As a result, this also began to limit ETH's ability to fight against long-tail altcoins as a financing currency, a strategy many market participants used in the past 12-18 months.
Figure 1. ETH Short Futures Liquidation Volume Rebounded in May
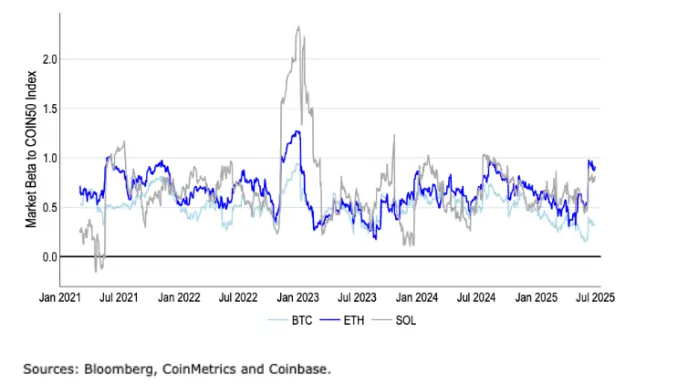
In fact, ETH's beta coefficient relative to the crypto market (represented by the COIN50 index of the top 50 crypto assets by market cap) rose close to 1 in mid-June. (ETH's beta coefficient has fallen to 0.92 in July, though still higher than SOL's 0.81 and BTC's 0.32). In other words, ETH's returns are currently synchronized with the overall crypto market performance. See Chart 2. This makes ETH an attractive option for a barbell strategy to counter tokens further along the risk curve, as these ETH long positions can help anchor tokens with higher risk exposure and asymmetric upside potential.
Figure 2. ETH's Beta Coefficient Relative to Crypto Market is Very Close to 1
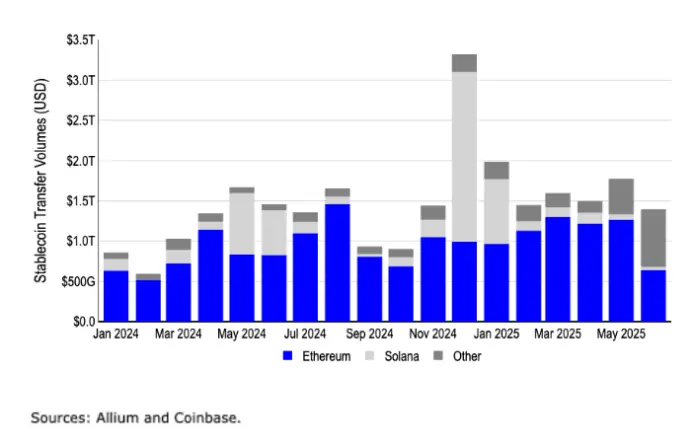
Meanwhile, proposed upgrades such as EIP-9698 (raising Ethereum's gas limit from 36 million to 3.6 billion) and EIP-7983 (limiting the maximum gas amount per transaction) have limited effects on ETH performance. These technical improvements primarily focus on improving transaction throughput and block execution efficiency. The more significant market change is the growing interest of institutional investors in tokenized stocks and risk-weighted assets (RWA), with infrastructure tokens for these assets receiving more funding attention as investors speculate on potential platforms.
Figure 3. Stablecoin Network Transfer Volume (USD)
Solana Ecosystem Expansion
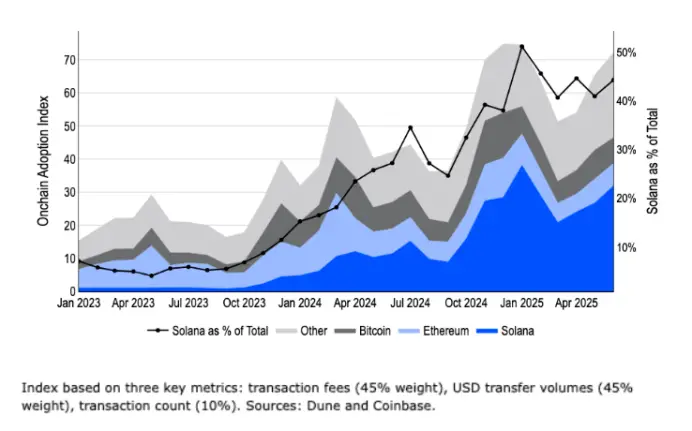
On the other hand, the Dune Analytics index shows that since the end of Q2 2024, Ethereum's share in on-chain activity has been continuously declining, while Solana currently occupies 44% of total blockchain activity. Figure 4 displays this index data, which tracks blockchain adoption by combining three key metrics: transaction fees (45% weight), USD transfer volume (45% weight), and transaction count (10% weight). Fees and transfers have higher weights because they better reflect meaningful activity. This trend indicates a fundamental shift in blockchain adoption patterns over the past year.
Figure 4. Comprehensive View of On-Chain Adoption
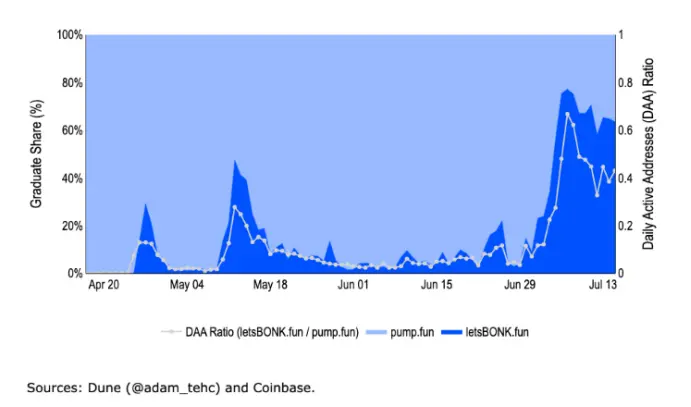
Solana network activity is primarily driven by meme coin trading, especially since pump.fun launched in January 2024, which became the main driver of Solana's expansion. The challenge Solana faces is that interest in meme coins may peak in early 2025, with data showing that over 60% of mature meme coin projects currently come from the letsBONK.fun platform. Market observations suggest that the meme coin trading frenzy may peak in early 2025 but is expected to maintain a certain market activity. With events like the first PUMP token issuance on July 12, investors can now participate in the meme coin market through multiple channels, no longer limited to simply going long on SOL tokens.
Nevertheless, stress-testing Solana's ability to handle massive transaction volumes could help it achieve product and market fit with other growing areas of the crypto ecosystem. In fact, Solana recently launched the Solana Attestation Service as a KYC/AML layer to serve capital market opportunities. The Solana Foundation also released a white paper in May titled "Tokenized Stocks on Solana: A New Paradigm for Capital Markets," further clarifying its layout direction in the digitization of traditional financial assets.
Figure 5. Comparison of "Graduated" Token Proportion and Active Addresses
However, at present, SOL's price will be more driven by technical factors, such as the growing demand for enterprise fund management tools and capital inflows from the US spot SOL ETF. Regulatory information suggests that these SOL ETFs could be approved as early as this quarter. (The REX-Osprey Solana + Staking ETF is not an SEC-officially approved product, and the SEC has revealed a new framework that may shorten future ETF approval times.) On the technical level, some meaningful upgrades may be imminent, such as Solana's Alpenglow proposal - a transformative upgrade that will replace the current consensus mechanism, accelerating consensus speed through local timers and off-chain voting mechanisms. This aims to improve network performance and reduce validator costs. However, market analysis indicates that the current SOL price volatility has limited correlation with these technical upgrades.
Enterprise Demand
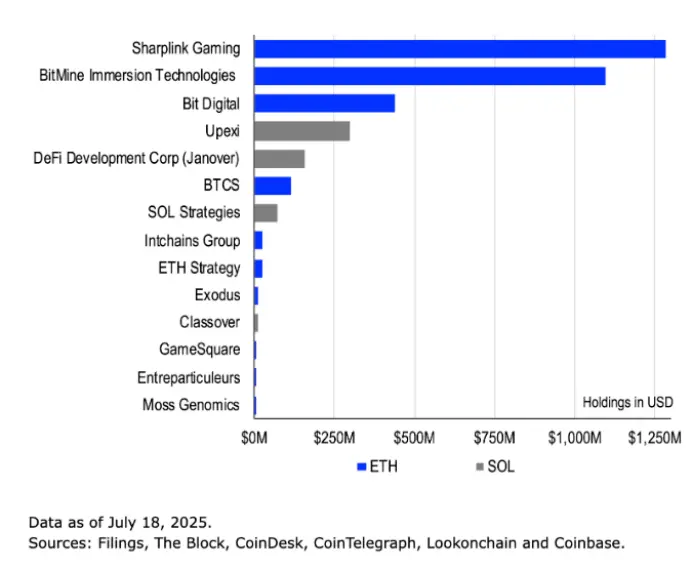
In 2025, enterprise financial tools significantly increased their cryptocurrency holdings, adding over 825,000 ETH (worth $3 billion as of July 18) and 2.95 million SOL ($531 million) across 14 specialized purchasing entities. See Figure 6. Moreover, many such companies have committed to staking their ETH and SOL for yields, with some even locking their supply through DeFi integration, demonstrating a strategic shift from short-term trading to long-term asset allocation. In fact, these tools' preference for ETH and SOL is partly due to their yield generation potential, which is further amplified by media coverage of stablecoins and tokenized securities. According to previous monthly outlook reports, enterprise balance sheets will remain the primary driver of cryptocurrency market demand in the second half of 2025.
Figure 6. Top ETH and SOL Enterprise Financial Tools
Conclusion
While institutional investors have favored BTC for most of this cycle, investors are gradually turning to selected altcoins like ETH and SOL, which seem relatively undervalued. Benefiting from the GENIUS Act's passage in Congress, ETH is increasingly seen as a representative of the thriving real-world assets theme. Nevertheless, both ETH and SOL are supported by institutional investor interest and their beta value to the broader cryptocurrency ecosystem. Although Solana has seen a slowdown in meme-coin-driven activity, it is demonstrating its high transaction volume and ability to explore new territories. In the short term, technical factors may dominate price trends, including capital flows, market sentiment, and other indicators.